Monitor your agents
Dashboard shows how your agents are doing: how often they run, how many succeed, how long they take, what they cost and why runs fail. From any number you can open the runs behind it and each run's full trace. This article explains Dashboard, a run's trace, and what the statuses and codes mean.
Open Dashboard
Select Dashboard in the sidebar. It opens on your whole workspace.
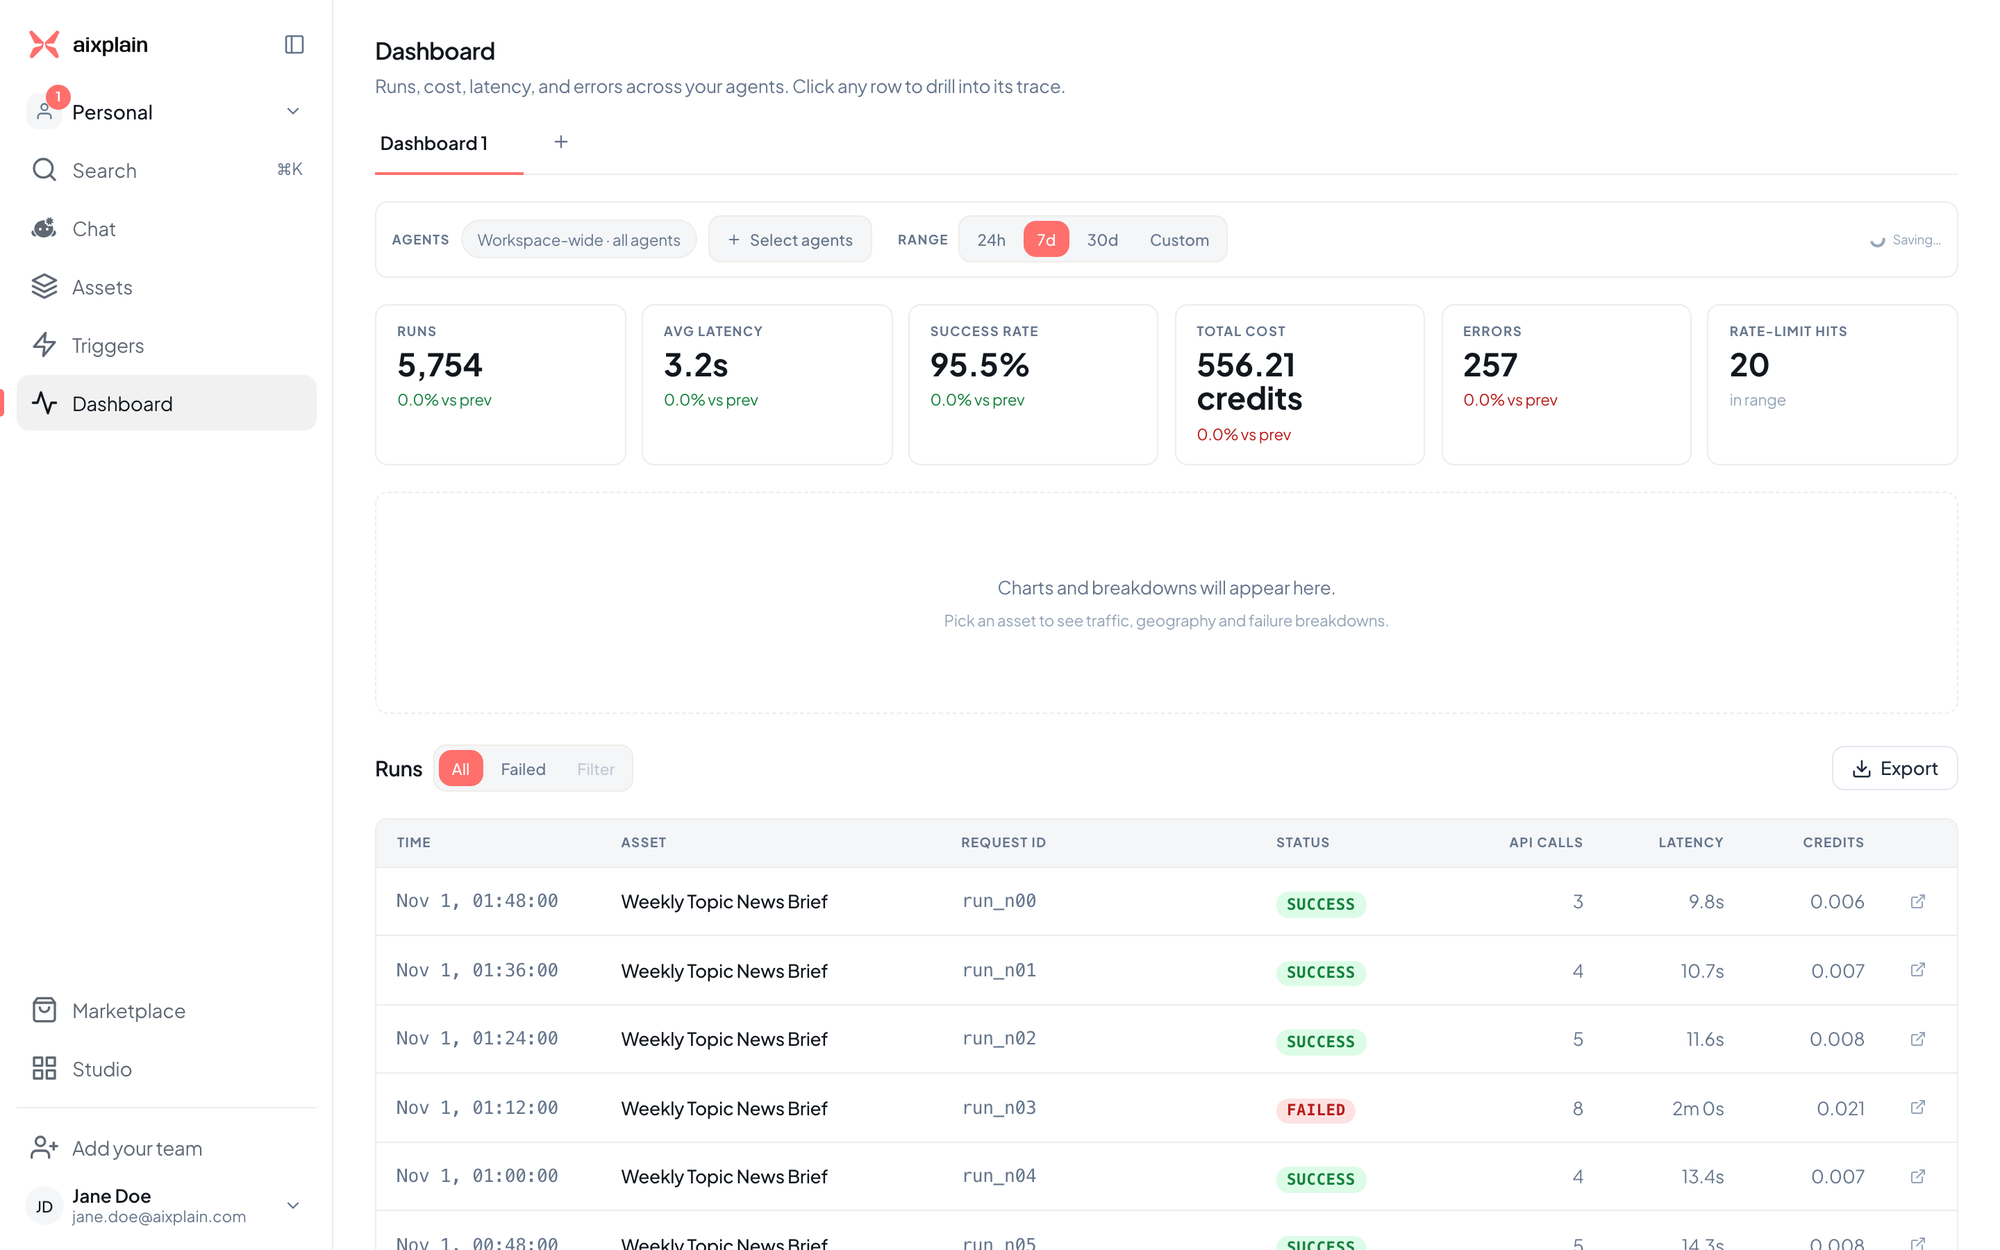
- Agents: Workspace-wide · all agents by default. Select Select agents to pick one or more.
- Range: 24h, 7d, 30d or Custom, with your own start and end.
- Cards: Runs, Avg latency, Success rate, Total cost in credits, Errors and Rate-limit hits, each with its change against the period before.
- Runs: the latest runs across your agents, with All and Failed filters.
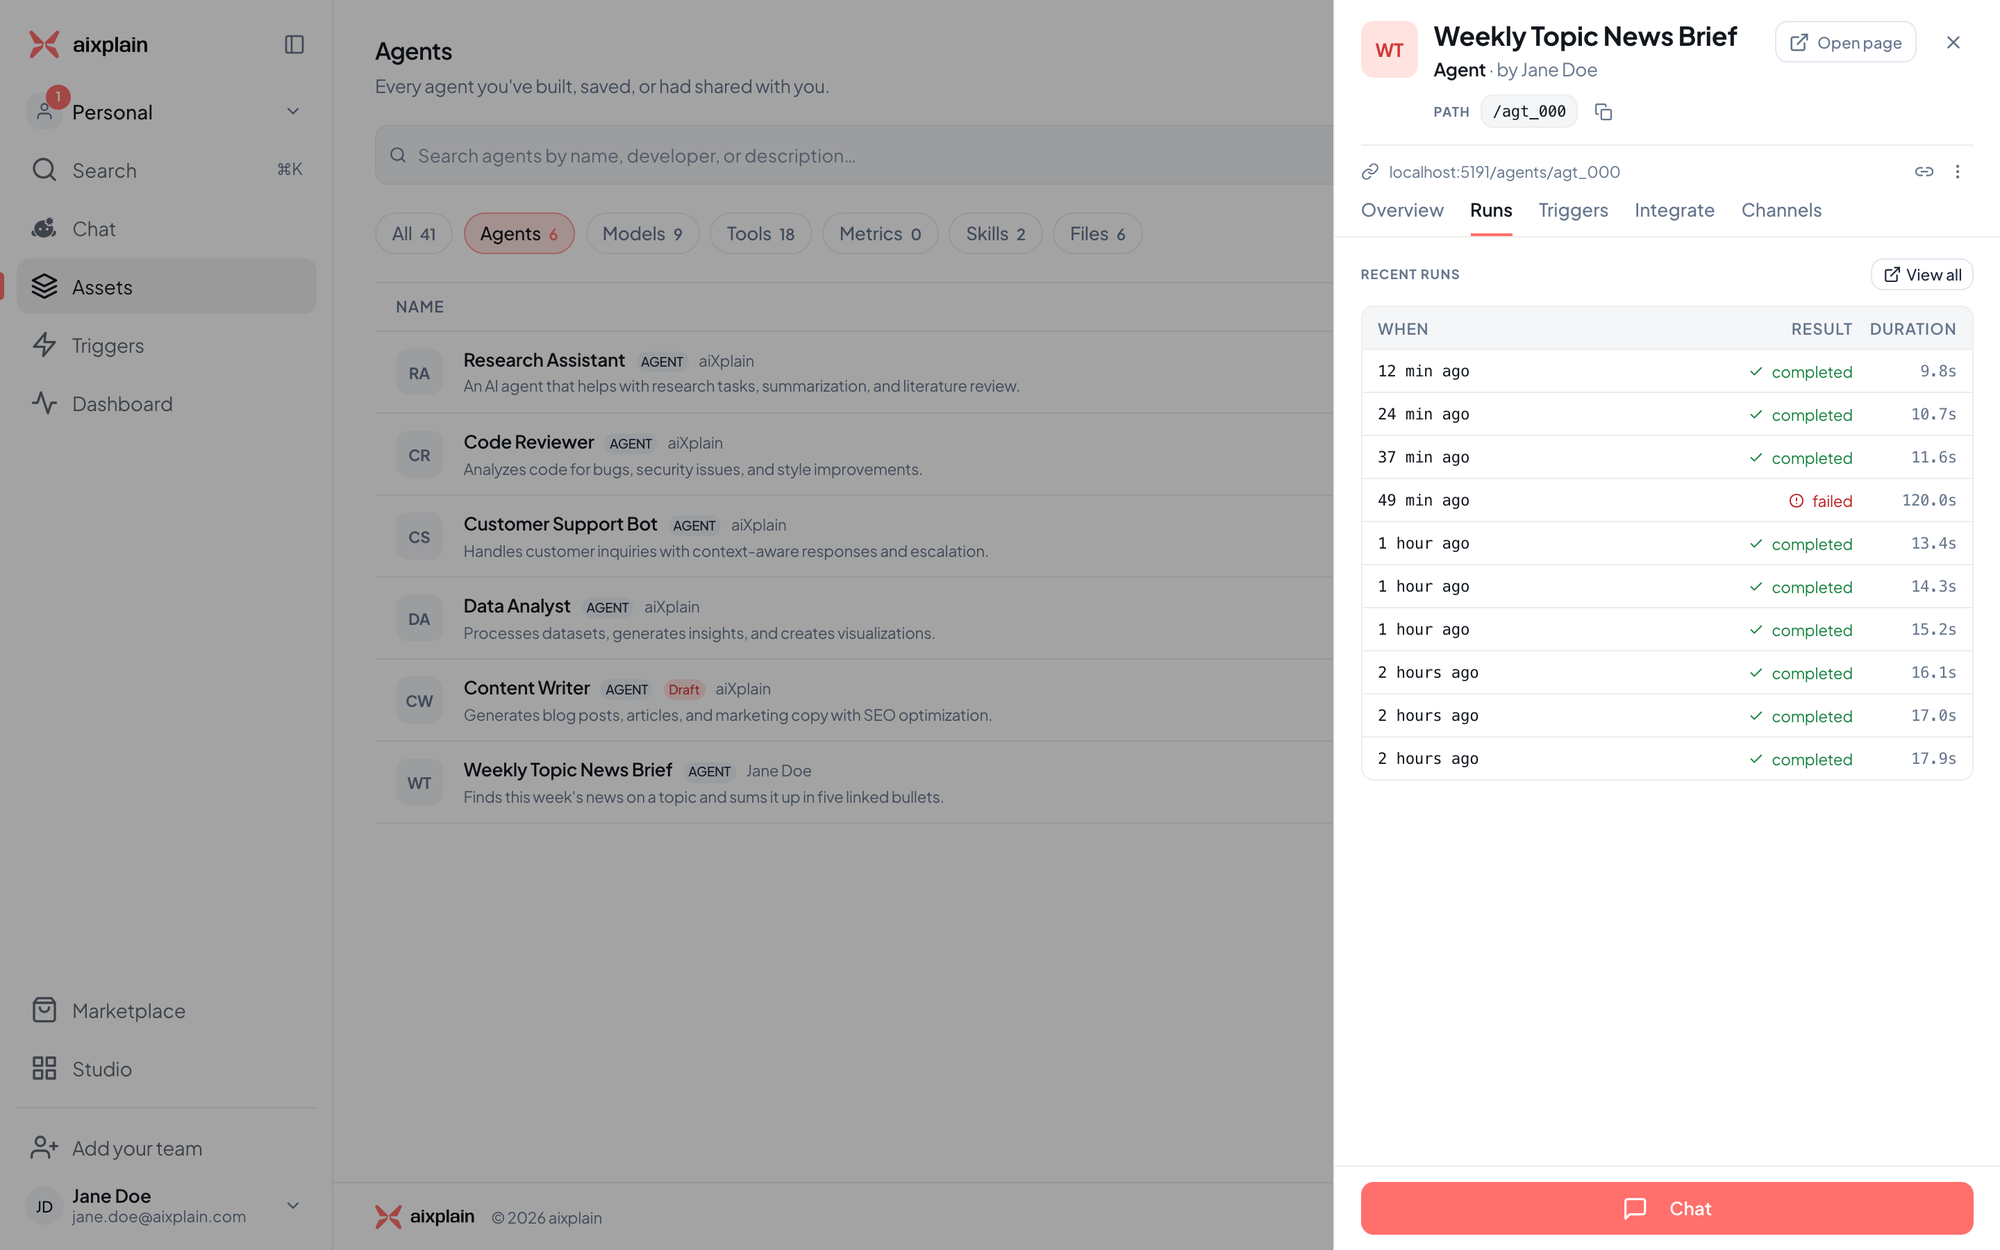
You can also open an agent in Dashboard from the agent itself: in Assets, select the agent, open its Runs tab and select View all.
Watch one agent
Pick one or more agents under Agents to see them on their own.
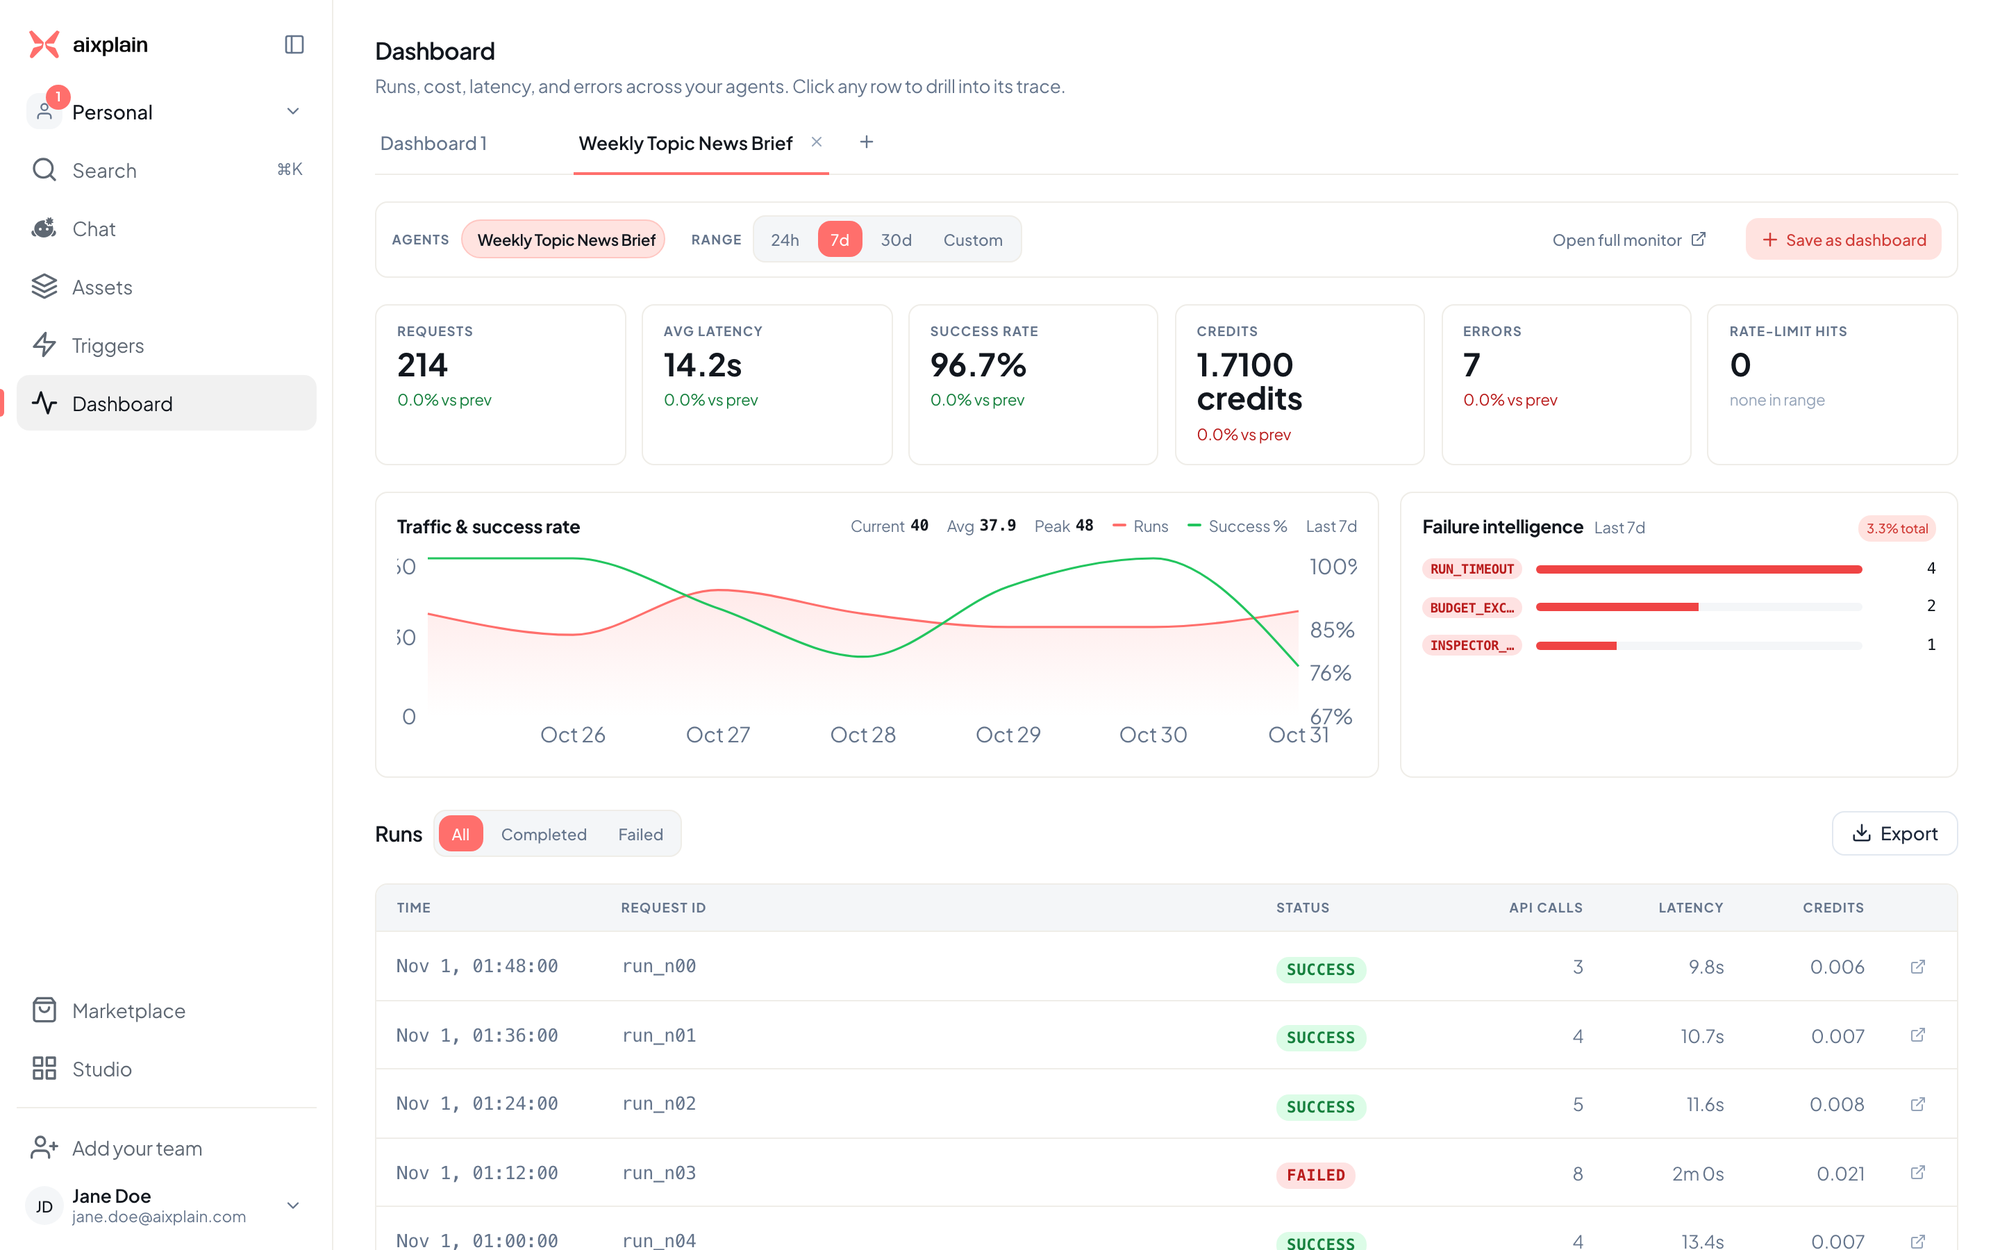
| Part | What it shows |
|---|---|
| Requests | How many times the agent ran in the range |
| Avg latency | How long a run takes, on average |
| Success rate | The share of runs that finished without an error |
| Credits | What the runs cost. One credit is one US dollar |
| Errors | How many runs failed |
| Rate-limit hits | How many requests were turned away for going over a rate limit |
| Traffic & success rate | Runs and success rate over time, with the current, average and peak number of runs |
| Failure intelligence | The share of runs that failed and the most common error codes, with how often each happened |
| Runs | Each run's time, request ID, status, API calls, latency and credits, with All, Completed and Failed filters |
Save and share a view
- Save as dashboard keeps the agents and range you picked as a tab, so you can come back to it. Your changes to a tab save as you go.
- Select + next to the tabs to start a new dashboard. You can pin a dashboard you use often and close the ones you don't.
- Export downloads the runs in the range as a CSV file.
Open a run's trace
Select any run to open its trace beside the list.
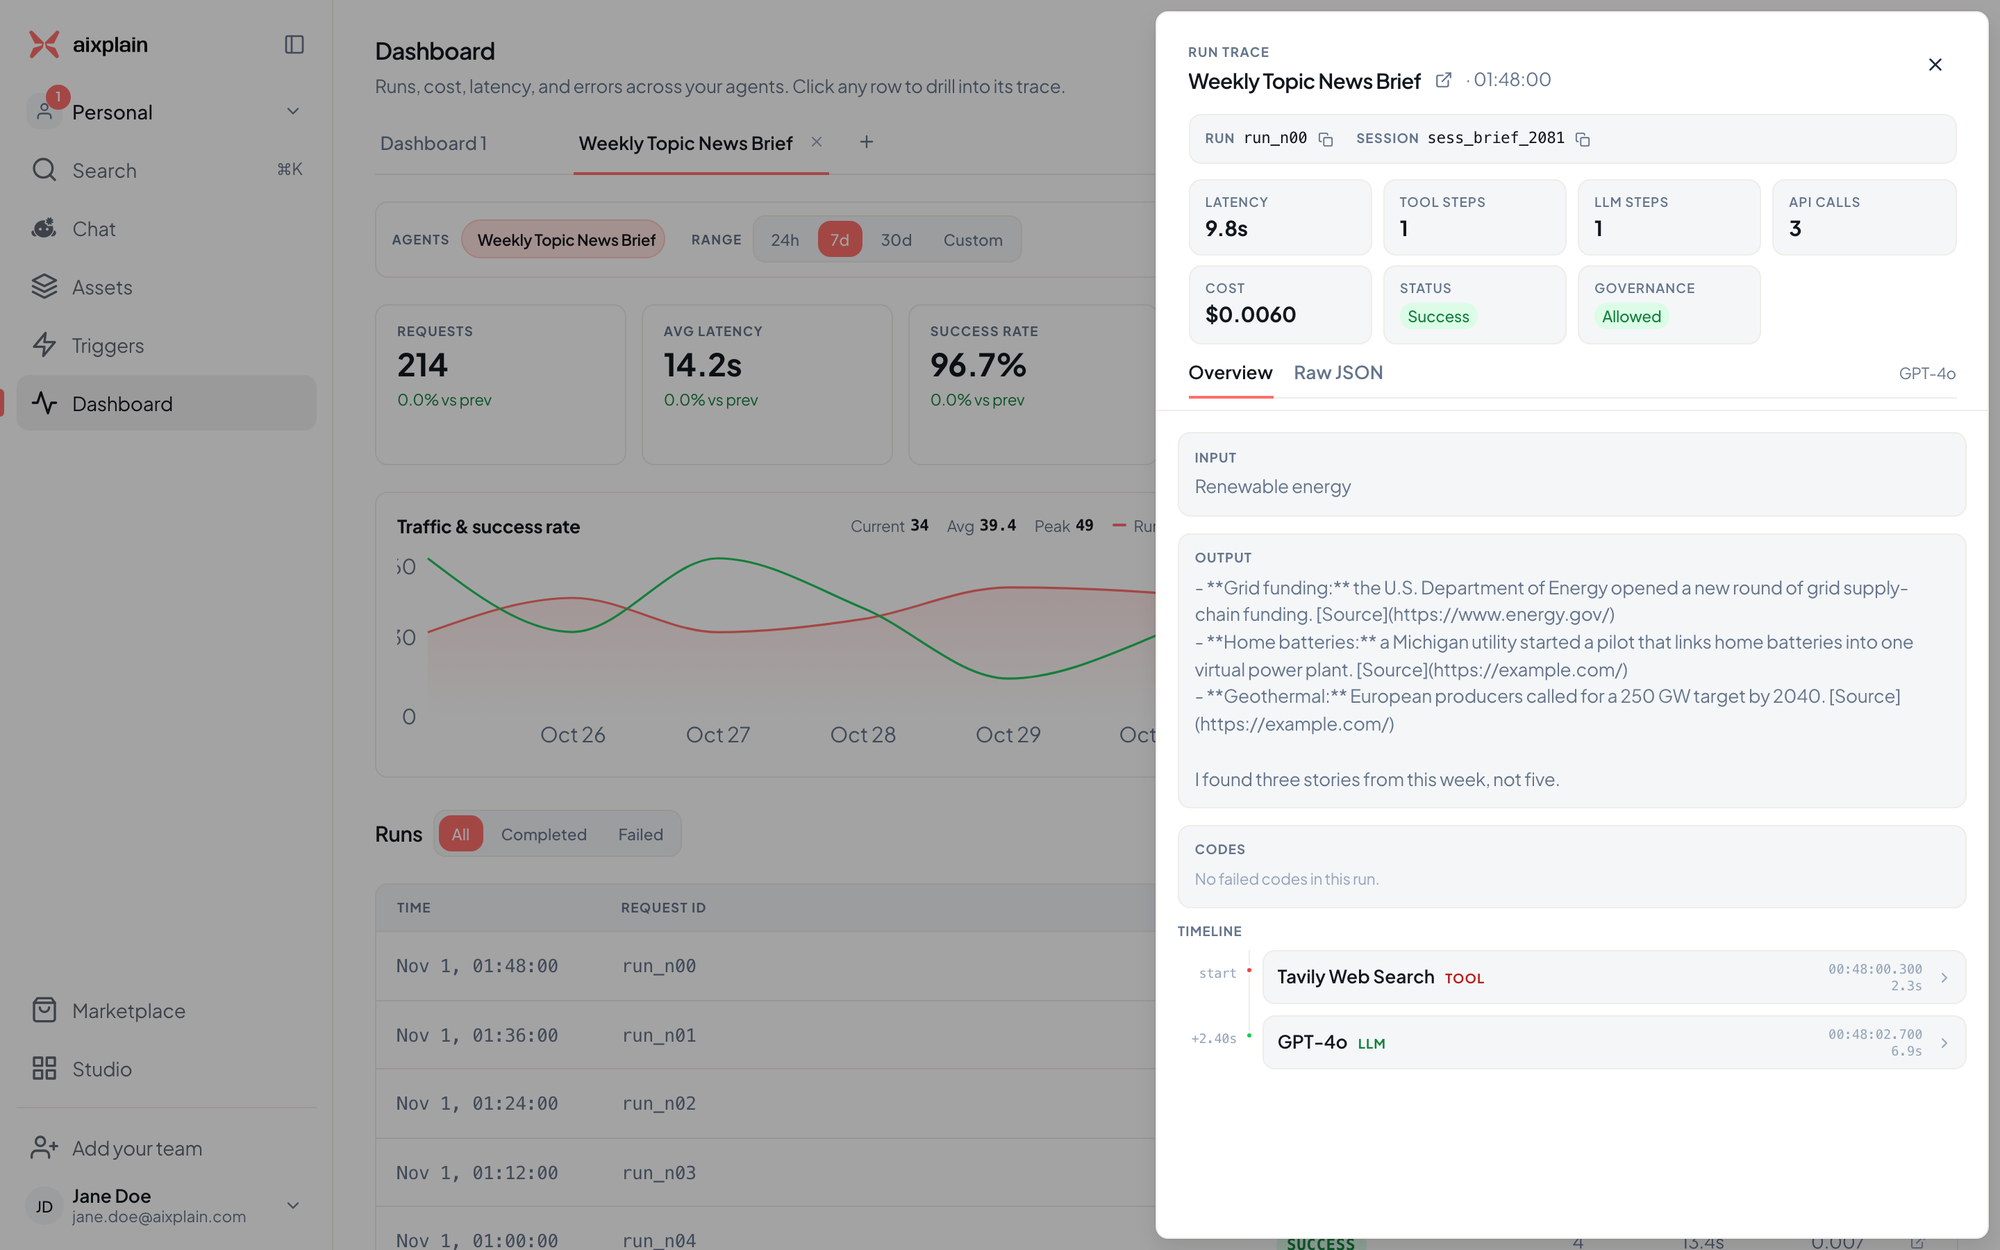
- Run and Session: the run's request ID and its conversation, each with a copy button.
- Latency, Tool steps, LLM steps, API calls and Cost.
- Status: whether the run succeeded or failed.
- Governance: whether an inspector or a limit stopped the run.
- Overview: the run's input, its answer, the earlier turns of the conversation, any codes, and a timeline of each tool and model step with its time.
- Raw JSON: the full record, ready to copy.
Statuses and codes
Run status
| Status | Meaning |
|---|---|
SUCCESS | The run finished and returned an answer |
FAILED | The run ended with an error. Its error code says why |
IN_PROGRESS | The run is still working |
A run an inspector or a limit stopped still shows SUCCESS, because it finished on purpose. Its governance status says what stopped it.
Common error codes
| Code | Meaning | What to try |
|---|---|---|
RUN_TIMEOUT | The run took longer than its time limit | Raise Max duration, or narrow the task |
BUDGET_EXCEEDED | The run reached its credit, time or step limit | Raise the limit, or check why the run needed so many steps |
INSPECTOR_ABORT | An inspector stopped the run | Read the inspector's reason in the trace |
APPROVAL_TIMEOUT | A step waited for approval and nobody answered in time | Approve sooner, or change the step's permission |
429 | A rate limit turned the request away | Space out requests, or ask about higher limits |
For the governance statuses (ALLOWED, BLOCKED_BY_INSPECTOR, BLOCKED_BY_BUDGET and more) and the limit codes (RUN_LIMIT_COST, RUN_LIMIT_DURATION and more), see Guard agents with inspectors.
Check runs while you build
While you build an agent in Studio, the builder's Tracer tab lists the agent's runs from the last 7 days, with All and Failed filters and Export. Select a run to see each step's input, output, reasoning, time and cost. In aixplain Desktop, each test run on the Test tab shows its time and cost. See Build and deploy agents with Omni.
Limitations
- Dashboard shows agents in your current workspace only.
- The workspace-wide view doesn't have charts yet. Pick an agent to see them.
Frequently asked questions
Why does a blocked run count as a success?
Because the run finished: an inspector or a limit ended it on purpose and returned a reason. Its governance status, in the run's trace, shows it was blocked.
Where do I see thumbs up and down?
Dashboard doesn't show feedback on answers yet.
Can I see runs from WhatsApp or Telegram?
Yes. They're runs like any other, and they appear in Dashboard with the rest.
Get help
- Build an agent: see Build and deploy agents with Omni.
- Report a problem: email care@aixplain.com with the agent, the run's request ID and what you expected. Remove credentials and private data first.
Still need help?
Report a bug on GitHub or write to us, and include your version and operating system.